Time-Segmented Asset Allocation: The Bucket Approach to Retirement Income Planning
We all know that when the markets turn down, the time can be fraught with peril and be a risk to our long-term savings.
No one likes to see a downturn in the market, especially those who are nearing retirement. In fact, for many such investors, a market correction is so alarming that they make rash financial decisions. Unfortunately, changing strategies in the middle of a downturn can lead to a worse outcome as you lock in losses or miss unexpected opportunities – both of which are just a couple examples of mistakes that can be worse than the initial fall in the market.
In my experience of nearly 30 years, I find that you need to be more concerned with the sequence of returns, your time horizon, and income needs as opposed to the returns of any given year. As an example, an investment portfolio that experiences negative returns during the early years of retirement – when a retiree first begins taking withdrawals from the account as income – may run out of money much faster than anticipated. This can also occur at the end of retirement when retirees are more likely to deal with long-term care expenses. This phenomenon is known as acceleration of depletion and happens during market downturns.
Let’s examine this issue a bit further.
The Flaw of Averages
To more fully understand how the sequence of returns may affect your retirement savings, you need to understand the difference between an average rate of return and a compounded rate of return.
In many cases, investors rely heavily on the posted average rate of returns provided by mutual funds and the like. To find the average return of an investment over the last 10 years, one can simply add up the yearly returns and divide by 10. But this average rate of return is not the whole story.
You will want to be very careful. The average rate of return does not tell you what the return for an investment has been in the past for all investors. This is because the average rate completely ignores the ability of the investment to compound differently based upon:
The sequence of returns (more on this below)
The timing and amount of inflows and outflows throughout the life of a specific investment
The compounded rate of return is not as easy to calculate, but it is not difficult to understand if illustrated properly.
Here’s an example:
PORTFOLIO 1

An investor invests $10,000 per year for 10 years into each of two investment portfolios with different sequences of returns but the same average rate of return. Remember to get the average you add each annual return number and divide by 10. {-20 + -10 + -5 + 30 + 25 + 20 + 30 + 10 + -5 + 25= 100/10 See what I mean?
Note, however, that this first portfolio in the example lost money in the first three years and again in the ninth year. In the remaining six years, the portfolio gained money. Despite these losses, this portfolio earned an average rate of return of 10% over the ten-year period.
PORTFOLIO 2

The second portfolio also has its ups and downs – with losses in years 8, 9, and 10, and gains in the remaining seven years. This portfolio also earned an average rate of return of 10% over the same ten-year period.
If you only looked at the average rate of return, you would assume that each portfolio made the same amount of money due to both averaging 10%, but you’d be incorrect. Because of the actual sequence of annual returns, the first portfolio had an ending balance of $213,801, while the second portfolio had an ending balance of $108,079.
The flaw of averages is that it does not take into account compounding or the sequence of returns. This means that using averages in your retirement plan projection is as effective as trying to forecast the weather on your birthday 20 years from now!
Now, let’s take this one step further.
Sequence of Returns While Retired
In this first scenario above, the investor put $10,000 in each portfolio each year for 10 years and left it there during the ups and downs of the market. But what happens if you are already retired and need to withdraw money for living expenses?
In this example, we will use the same yearly sequence of returns and average yearly returns as above. Retiree A has $100,000 in Portfolio A at retirement, and Retiree B has $100,000 in Portfolio B at retirement. They both withdraw 6% the first year and increase that withdrawal by 3.5% each year thereafter. What happens at the end of 10 years?

After 10 years, Retiree A has just $88,862 left in the portfolio. Retiree B, on the other hand, has $161,203. The reason? Negative returns during the first years of retirement, as happened to Retiree A, hurt his portfolio far more than negative returns in the middle of retirement, as with Retiree B.
The lesson from both of these examples is simple:
Compound rates of return are different than the average rate of return. And cash flow behavior, when combined with the actual sequence of returns results in actual investor return – which is very different than the average rate of return.
In other words, the timing of negative returns has a great effect on a retirement portfolio.
Unfortunately, you cannot always retire when the market is high, nor can you predict when the market will turn. Thankfully, there is an approach that is designed to help those in or nearing retirement weather a rocky market. You may have heard of it referred to as time-segmented asset allocation, time-segmentation, or the “bucket approach.”
The Bucket Approach
Here is a quote I often use with clients as I explain how to turn retirement savings into retirement income: “The Investment and tax strategies used to accumulate wealth are inherently different than those used to distribute wealth.”
Because of this truth, investors nearing or at retirement may need to change tactics to manage financial risks successfully. Plus, because each retirement looks different, there is no one “right” plan. For instance, you might need a plan that helps you pursue a strategy to triple your income over 30 years, or you might need to pursue a strategy to double your income in 15 years.
The goal is to strike an intelligent balance of low risk or even guaranteed income investments with more growth-oriented investments – because both have their downsides.

The bucket approach takes into account the pros and cons of different investments and tries to create an income that will last through your retirement. Here is how it works.
Break down your retirement income needs into smaller chunks of time – usually 5 to 7 years.
Determine the number of total assets you need to supply all the income goals for each period. The income needed includes must-haves such as health insurance, housing, and food, as well as wants like travel or entertainment. The income needs will also include assumptions, such as increased living expenses or higher medical bills as you age. It may be critical to take into account that income needs may inflate at different rates.
Create investment buckets for each period of time. The closer the bucket is to an immediate need for income, the more conservative the investment portfolio is. Riskier investments are changed to more conservative ones as the bucket gets closer to use for income.
The Bucket Approach – A 15-year Example

The latter buckets are invested progressively more aggressively to have a chance to grow. Because they are designed to be left untouched for 5 years, 10 years, or more, and thus the time horizon is longer, investors can afford to let them ride up and down with the markets. Many retirement plans are carried out with this type segmentation for as many as 25 to 30 years or more. Sometimes, we consolidate and lengthen segments for that reason.
Determining the Investments for Each Bucket
But how do you determine the right investments for each bucket? That is where our rolling period analysis comes in. It helps us plan based on probabilities of success driven by nearly 100 years of sequence of market returns rather than the average rate of returns.
Our software has market data on major asset classes from the Chicago Research and Security Prices Database starting in 1926. We use this data – not to try and predict how any given portfolio will do over time, but to try and stress test your retirement. Remember, past performance is no guarantee of future performance. I often say that history doesn’t, repeat but it often rhymes. Using this data analysis is not forecasting but rather like ‘aft-casting’.
So, for the example above, we would do a 15-year analysis. The goal would be to have enough income to fund your retirement for 15 years, and if desired, leave an inheritance.
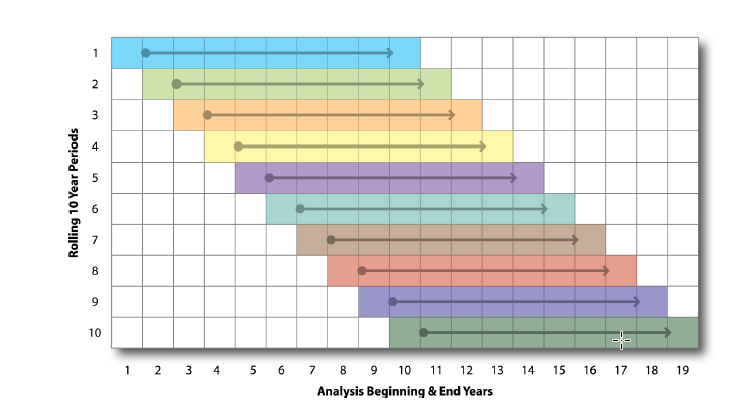
To determine the likelihood of success, the software begins analyzing 15-year periods to see how a given portfolio with the given assumptions (income sources, expense needs, wants, cost increases, etc.) does. It would start with an analysis of 1926 to 1941. Then it would do 1927 to 1942, and again for 1928 to 1943. This continues until you come to the last 15-year period with available data. And it analyzes each bucket as described above independently for each of these periods. This is what we call a rolling period analysis. Graphically it would look like this for 10-year periods being analyzed.
Below are some sample graphs showing the results of a rolling period analysis as described. For client’s discussions this can be a great way to see how likely the current portfolio is to reach the desired goals to not run out of money. The software does much more than that though, such as it helps to determine which assets to spend first and which ones to continue growing. On each graph, each green line shows a successful 15-year period that didn’t run out of money. Of course, the red line depicts running out and how soon.
Below are 4 variations of the graph illustrating a client in their mid-70’s with their current resources and needs. Note how each percent is color-coded as follows:
GREEN- Satisfactory


YELLOW- Caution

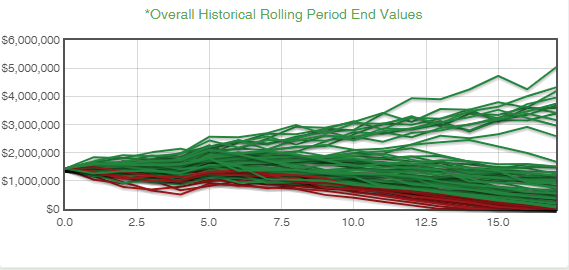
ORANGE- Warning


RED- Hazard


This bucket approach allows us to create a sound financial-based retirement income plan using nearly a century of data points. Although since no program can predict future results, having this rolling analysis can help illustrate the likelihood of success. And, because retirees understand how the portfolio was created, they are more likely to stay the course rather than make rash decisions when turbulent markets arise.
While the above information might seem like a lot to digest, it’s something I deal with daily. I can assure you that with just a little effort and time, you can put your money in the right places and give yourself a strategy that can help provide confidence for your financial future.
And you don’t have to do this on your own. In fact, you can self-schedule a free 15-minute call with me by clicking here. I’ll help answer your questions and point you in the right direction.
_____________________________________________________________
The examples presented are for illustrative purposes only and are not representative of any specific situation. Your results may vary. The hypothetical rates of return used do not reflect the deduction of fees and charges inherent to investing.
The projections or other information generated regarding the likelihood of various outcomes are hypothetical in nature, do not reflect actual investment results and are not guarantees of future results. These figures may exclude commissions, sales charges or fees which, if included, would have a negative effect on the annual returns.
No strategy assures success or protects against loss. Investing is subject to risk which may involve loss of principal.
All performance referenced is historical and is no guarantee of future results all indices are unmanaged and may not be invested in to directly. All investing involves risk including loss of principal. No strategy assures success or protects against loss.